
The advantages of Business Intelligence and Data Visualization are becoming more apparent to companies all around the world. Many of these firms utilize Power BI, a Business Intelligence tool, to deploy these valuable strategies on their business data, which is stored in the Cloud Data Warehouse and a variety of other places. Users may need access to these reports on many devices in a variety of situations. These devices may not have the processing power to host/run the full version of Power BI Desktop; in some cases, reports must be sent over email. Power BI Report Server can be a very valuable and effective tool in these situations.
In this blog, you will understand in-depth about Power BI Report Server, and Its key features.
Introduction to Power BI
Power BI is a cloud-based business intelligence solution that allows you to analyze and visualize data in real-time. It enables users to combine data from a variety of sources to generate Corporate Reports and Interactive Dashboards that provide critical information for strategic business decision-making. Power BI Desktop, Power BI Service [SaaS-based Solution], and several other app-based mobile solutions make up the Power BI solution.
The ability to develop graphical and data-driven reports as well as real-time dashboards aids business organizations in finding answers to the correct queries and providing an objective foundation for management decision-making.
Key Features of Power BI
Interactive Interface: The Power BI interface is based on an easy-to-use Drag and Drop user interface. The data can be used to build reports that do not require any programming experience.
Customizable Data Visualizations: The platform has several default templates that may be customized to meet the needs of different businesses. It also allows total customization of its templates to meet the requirements of the Report / Dashboard creation.
Secure Platform: Power BI sets up access to the control panel using a function called Active Directory. The platform is meant to develop and create security where each user is provided regulated access to data in addition to the usual security layer.
Easy to Implement: The platform is easy to set up and integrates easily into the workflow across the organization/department with little IT resources. Many components of report authoring do not necessitate any programming experience.
Related Reading: What is the Difference Between Power BI Desktop and Power BI Service?
What is Power BI Report Server?
Power BI Report Server is a report server that runs on-premises and hosts Power BI reports. Users can access the reports hosted on the on-premises report server using a web interface. Because the report server is based on the SQL Server Reporting Service (SSRS) architecture, it may also host paginated reports, mobile reports, and KPIs. You can use a web browser, a mobile device, or email to access and read all types of reports on the report server.
There are numerous benefits to hosting Power BI reports on an on-premises report server. It is Power BI Service compatible, and you can easily combine it with your existing Reporting Services.
(Source: Microsoft)
Key Features of Power BI Report Server
On-Premise Capabilities: The reports on Power BI Report Server are hosted on-premises. On-premise solutions encourage users to collaborate securely. There is also the option of hosting. .rdl — Paginated Reports and KPI Dashboards, and mobile – Mobile Reports
Custom Visualizations: It allows you to create your visualizations. [In addition to the basic customizations, 100 more were added]
Mobile Connectivity: Reports stored in Power BI Mobile can be accessed via mobile connectivity. Platforms such as iOS, Android, and Windows Mobile are supported.
Data Export: It allows you to export data to CSV and.xlsx files, among other formats.
Power BI Report Server Components
The Power BI Report Server has the following major components:
Elements of Power BI Report Server
Following are the key elements of the Power BI Report Server:
- Web Portal
- Power BI Reports
- Paginated Reports
- Mobile Reports
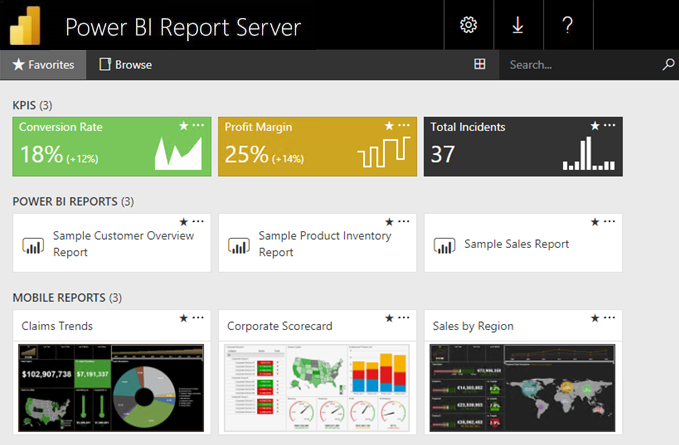
Web Portal
The secure Web Portal of Power BI Report Server is the primary interface through which the user will interact. The user can view their Reports, Dashboards, and KPIs from any device that can run a modern browser through this portal. The files are organized in a regular folder system, and the interface is simple to use. Power BI reports Mobile Reports, Paginated Reports, KPIs, and Excel Workbooks are among the categories of content. The Web Portal also allows you to schedule report processing, view reports on demand, and subscribe to reports.
Power BI Reports
Power BI Reports are multi-perspective data visualizations that are used to depict and analyze a specified dataset. This feature allows users to create.pbix reports in Power BI Desktop and then publish them to the online portal, where they can be viewed at their convenience.
Paginated Reports
These are reports that have tables that expand both horizontally and vertically. They are papers in the. rdl format that generates files that are optimized for printing, such as PDF and Word files.
Mobile Reports
These are the types of reports that can be accessed with an on-premise server connection. These reports include an interactive interface that adjusts to multiple mobile device screen sizes and aspect ratios. SQL Server Mobile Report Publisher is commonly used to build them. Integrating and analyzing data from a huge set of diverse sources can be very difficult, this is where Veelead comes into the picture. Veelead, with its strong integration with 100+ sources & BI tools, allows you to not only export & load Data but also transform & enrich your Data & make it analysis-ready in a jiffy.

Are You Looking for Power BI Services?
Our Veelead Microsoft Power BI consulting services will understand the vision of your business and create truly advanced data visualization and reporting solution. Get a free consultation now!