Power BI and Tableau are the top solutions on the market for business intelligence and data visualization. Data analysts are continuously debating the merits of Power BI versus Tableau. Since their inception, both applications have progressed tremendously.
For a long time, many data specialists have been grappling with this problem. Let’s compare and contrast two sophisticated data visualization applications, Power BI and Tableau, in order to make an informed decision.
Pricing comparison between Power BI and Tableau
When it comes to price comparisons between Power BI and Tableau, there is no contest. Both are on the opposing extremes of the pricing range, with Power BI being far less expensive than Tableau. Both of these BI applications are available in individual and enterprise editions, with the enterprise version costing much more. Again, there is a significant price difference between Power BI Pro and Tableau Creator, with the latter being significantly more expensive. While Power BI is available as part of Microsoft 365 or as a standalone solution, Tableau is sold on a per-user basis.
Related Reading: Power BI Free Vs Pro Vs Premium Plan Comparison
Tableau and Power BI both provide integration tools.
Because Power BI is a Microsoft product, it has a Microsoft 365 integration built-in. Power BI is included in the Microsoft 365 Enterprise E5 subscription, which also includes Office, Exchange, OneDrive, and SharePoint, among other Microsoft products and services. This enables Power BI to take advantage of the data and analytics capabilities of other Microsoft 365 apps. It can be used as a standalone application or as part of a larger workflow, allowing users to exploit organization-level dependencies from several data sources with minimal coding skills. Tableau, on the other hand, has relatively limited extensibility with popular products.
Power BI and Tableau provide data wrangling features.
One of the most significant parts of business intelligence is the transformation of data into visual insights. Data wrangling is possible with Power BI using a variety of approaches, which can be used while creating reports or when importing data. The speed and lead time for data presentation are faster when exploring data in Power BI. This provides Power BI the upper hand over Tableau.
Tableau, on the other hand, provides sophisticated tools for turning data into actionable insights with eye-catching visualizations. With a few clicks, users may create informative dashboards and do a variety of ad-hoc analyses.
Power BI vs. Tableau security features
For all of its products and services, Microsoft takes security very seriously. Power BI is no exception. It satisfies all security and compliance requirements to the greatest extent possible. Microsoft has been investing in security for years as a proponent of data protection. Tableau, on the other hand, is known for its visualization capabilities rather than its security requirements.
Support – Power BI vs. Tableau
Standard Support is included as part of Tableau’s subscription. It is good for one year with license purchases, after which users must conduct an annual Maintenance Renewal. Tableau’s Extended Support and Premium Support programs are also available to users.
Power BI provides users with a variety of support options to suit their needs. The Power BI community is an active peer-to-peer support group where users can get answers and help on topics including best practices. Pro and Premium customers can access the Power BI Support Site for technical assistance with Power BI content as well as administration support. Billing and enterprise-level assistance are available through the Microsoft 365 admin center. The majority of questions can also be answered by calling a designated phone line.
Users can get similar help from both Power BI and Tableau. If you elect to purchase one of Tableau’s paid support packages, the difference is in the price.
Adoption/Ease of Use
Newbies have a greater adoption rate for Power BI. This is because Power BI will feel familiar to anyone who has used Microsoft’s tools before. Its user interface is similar to that of Microsoft Excel, making it simple to use for newcomers. Power BI features a simple learning curve and makes use of Microsoft’s DAX query language, which advanced Excel users would be familiar with. While Tableau is simple to use once you are used to its interface, mastering the marks menu takes effort.
Capacity for Q&A
Power BI is the only tool that can perform Natural Language Query. This Natural Language Query has a surprising amount of sturdiness. Simply write a question, and Power BI will choose the best graphic for you to investigate. What’s more incredible is that the chosen visualization may or may not have been generated by the dashboard’s author. This is a game-changing feature that will make data available to everyone.
Power BI vs. Tableau – Comparision of Features
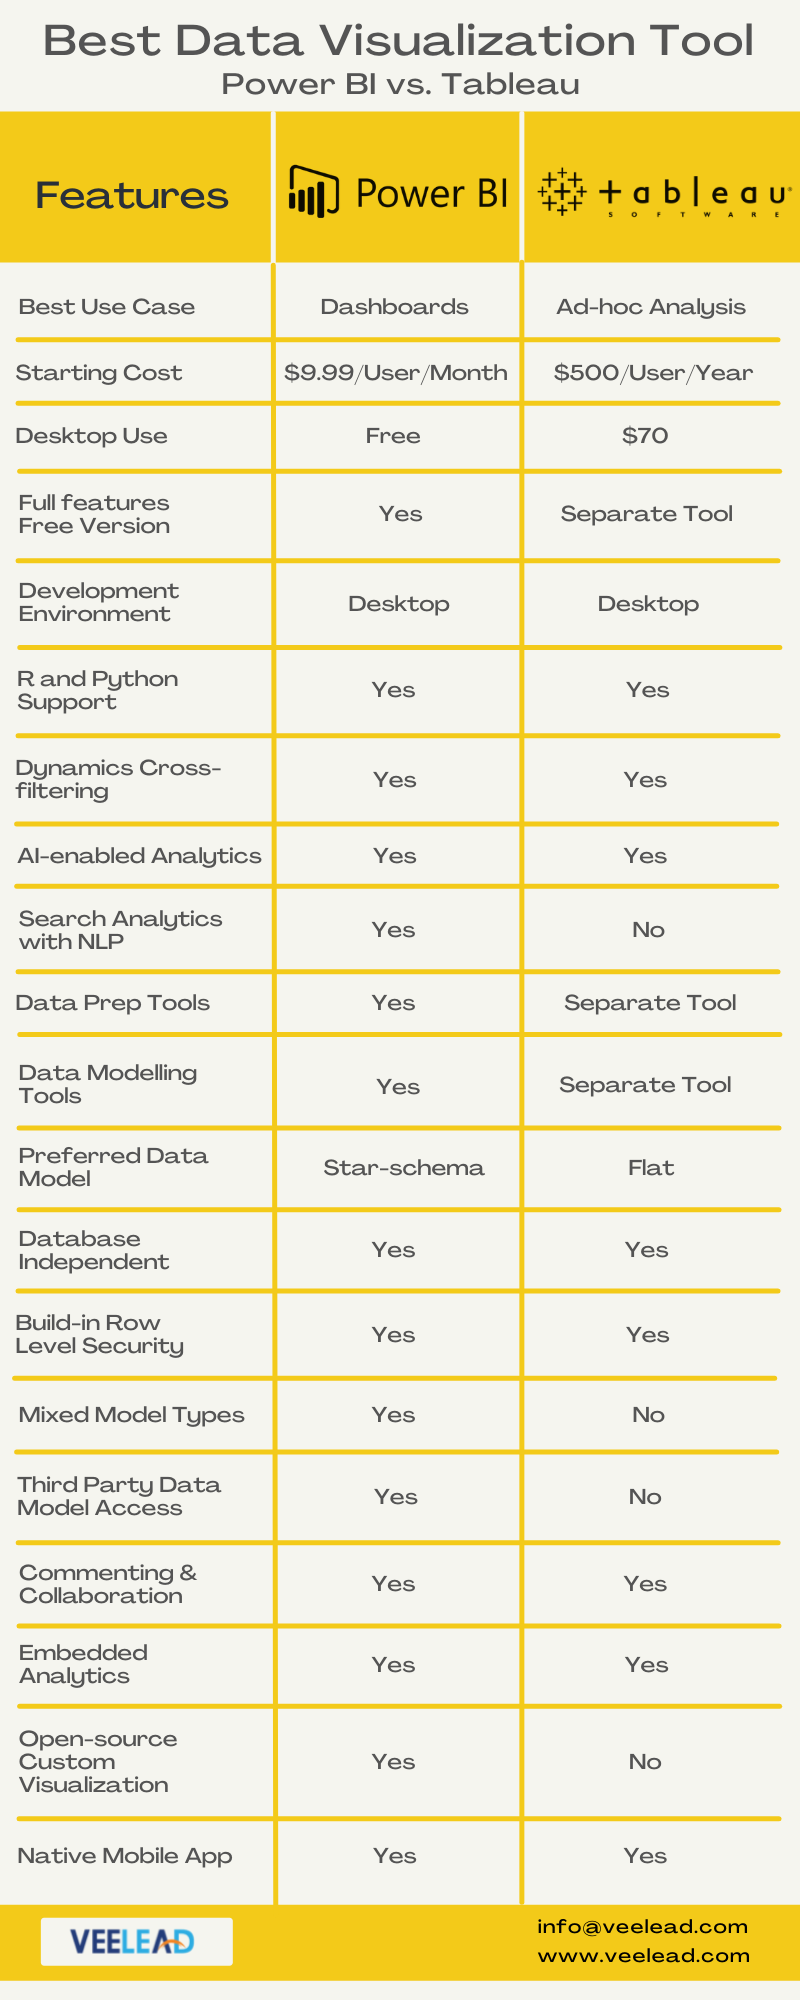
At Veelead, our Power BI experts are adept at weaving every feature of Power BI to handle the most complex requirement that your enterprise can have. By creating superior features and pairing that with the right pricing, Microsoft has created one of the most widely used data visualization tools. Get in touch with us to know more about our Power BI implementation services for your business.

Are You Looking for Power BI Services?
Our Veelead Microsoft Power BI consulting services will understand the vision of your business and create truly advanced data visualization and reporting solution. Get a free consultation now!